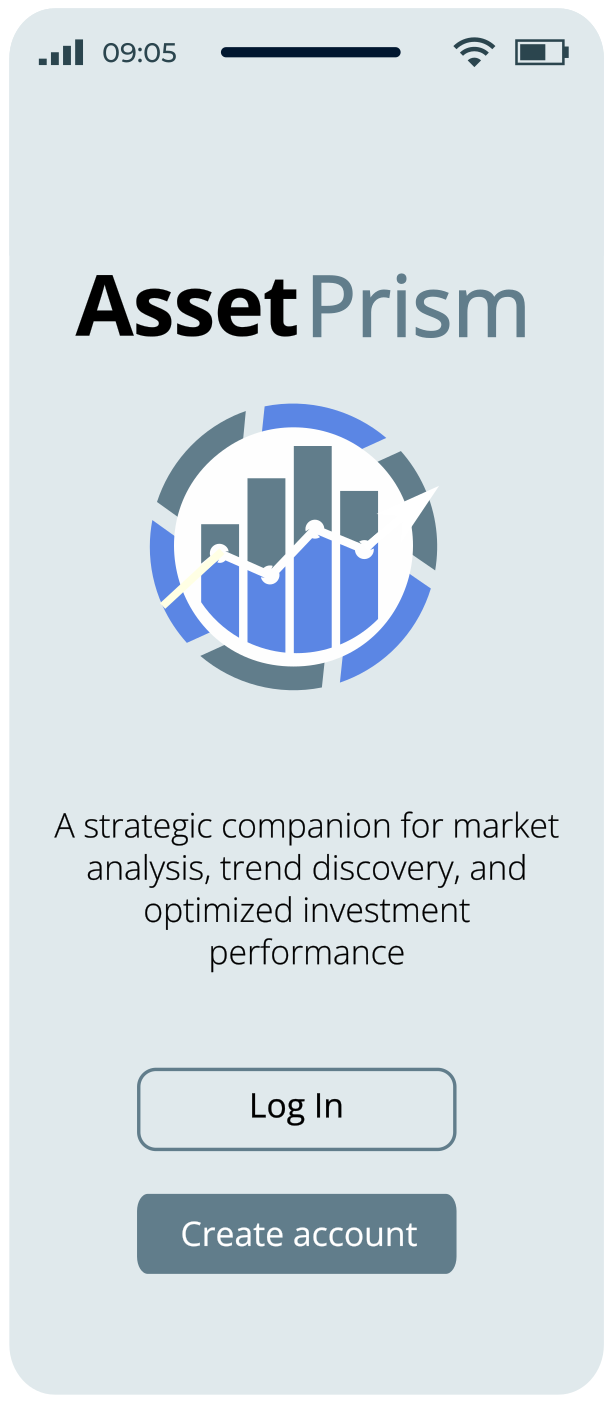
A strategic companion for market analysis
Discovery trends and optimize investment performance
Smarter Investing Made Simple
AssetPrism is a mobile application that provides powerful tools to track, analyze, and optimize your investments across a wide range of asset classes, including stocks, ETFs, cryptocurrencies, and more.
With intuitive visualizations, detailed performance metrics, and advanced technical indicators, it empowers you to make informed decisions. Whether you're comparing assets, calculating ROI, or assessing risk, the application helps you navigate complex financial data with ease.
Smart Analysis
Unlock powerful tools to analyze and optimize your investment strategy effectively.
Performance Insights
Gain deep insights into asset performance with advanced analytics.
Risk Management
Assess and manage investment risks with key metrics like Sharpe and VaR.
Custom Benchmarks
Create personalized benchmarks to track portfolio performance and growth.
Features
Navigate global markets, monitor key trends, and build actionable benchmarks

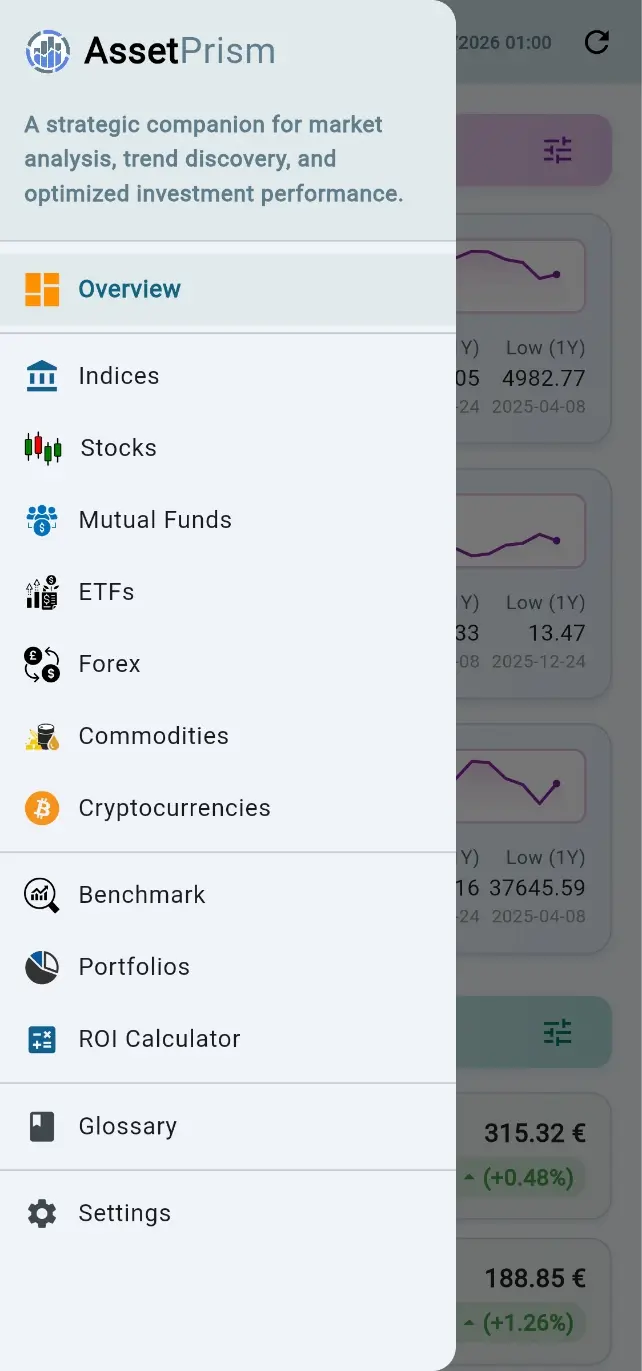
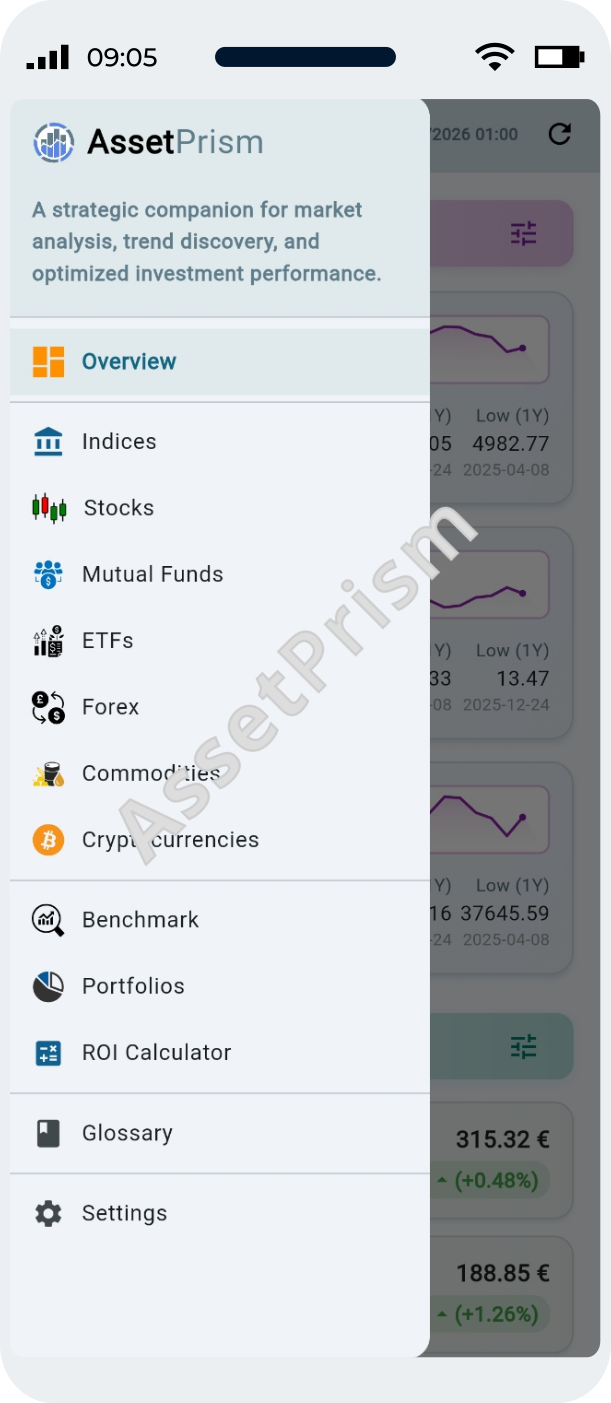
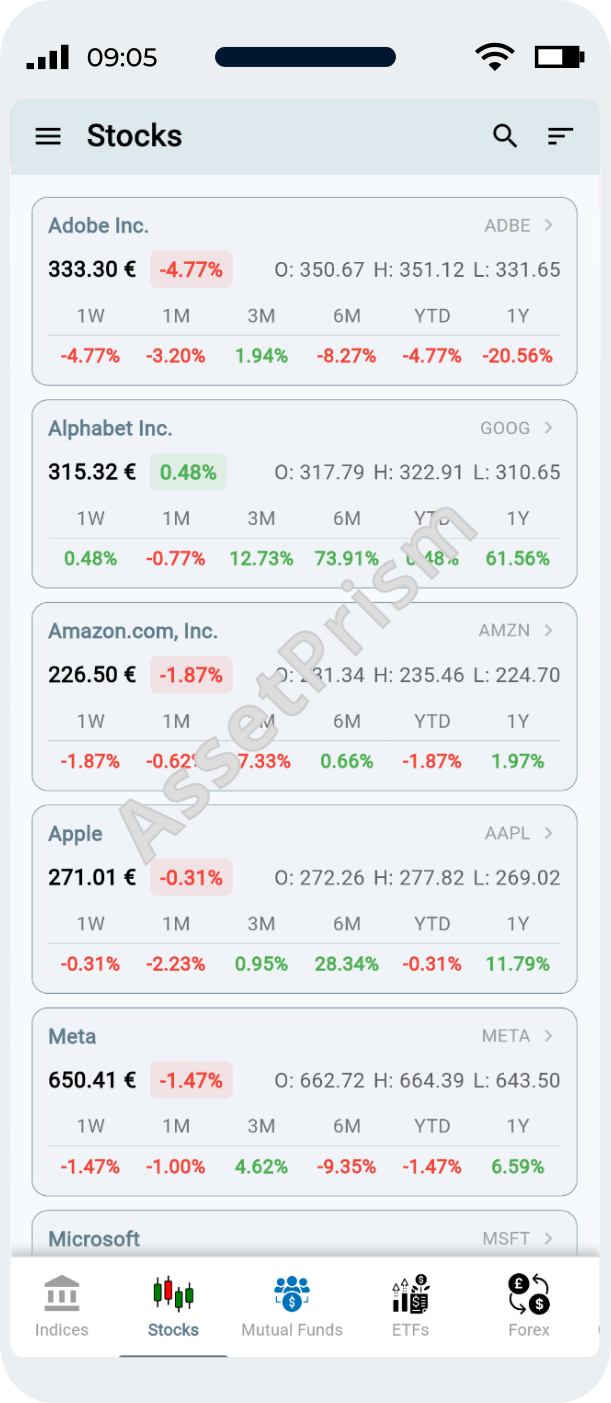
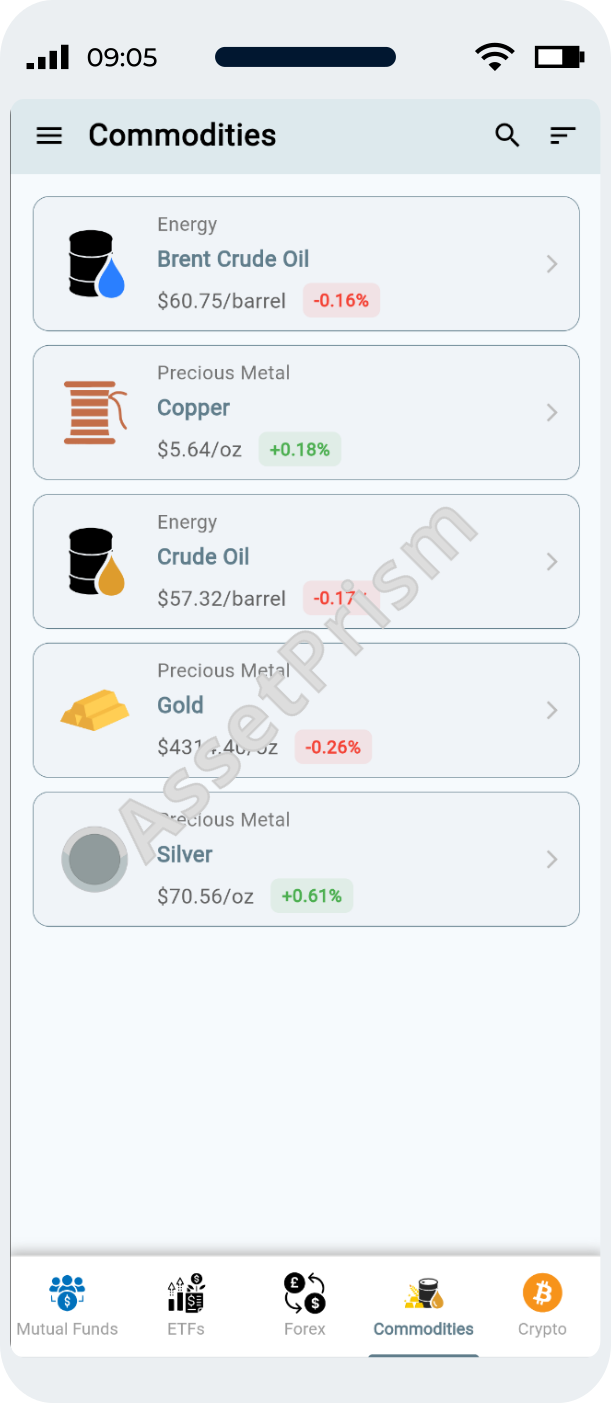
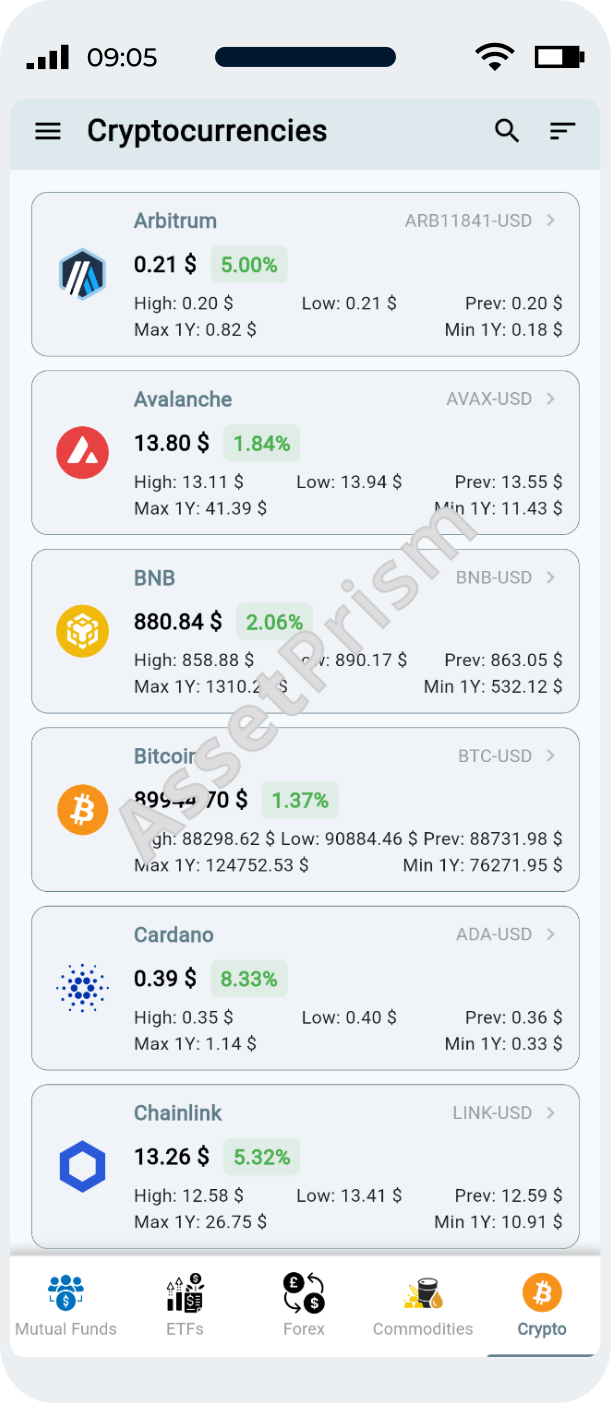
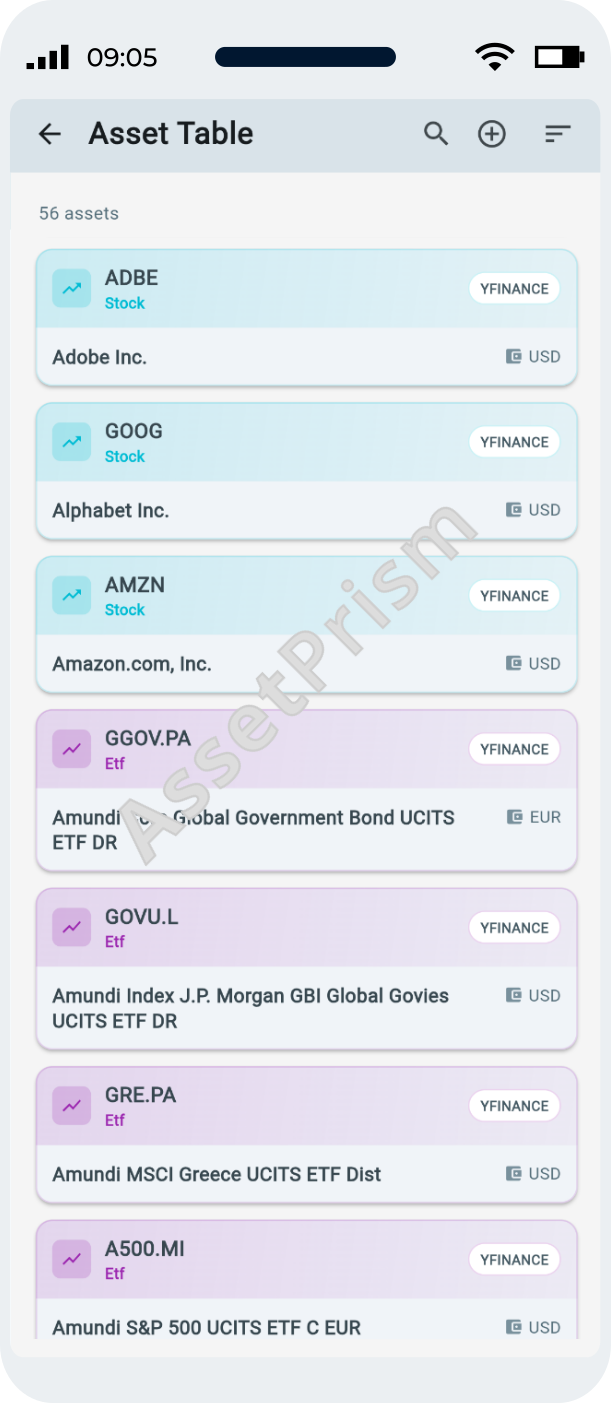
Explore Diverse Markets
Effortlessly track, analyze, and manage a broad spectrum of asset classes, from traditional investments like stocks, and mutual funds to modern financial assets such as exchange-traded funds (ETFs), commodities, and cryptocurrencies.
Whether you're monitoring long-term market trends or assessing daily fluctuations, AssetPrism enables you to stay on top of all your investments. With comprehensive tools at your fingertips, you can gain valuable insights into each asset type, helping you make informed decisions across diverse markets with ease and efficiency.
- Broad Asset Coverage: Track and analyze a wide range of asset classes, including stocks, indexes, mutual funds, ETFs, commodities, and cryptocurrencies.
- Flexible Monitoring: Stay updated on both long-term trends and daily market movements with ease.
- Informed Decision-Making: Use powerful tools and insights to make smart, data-driven investment choices across diverse markets.

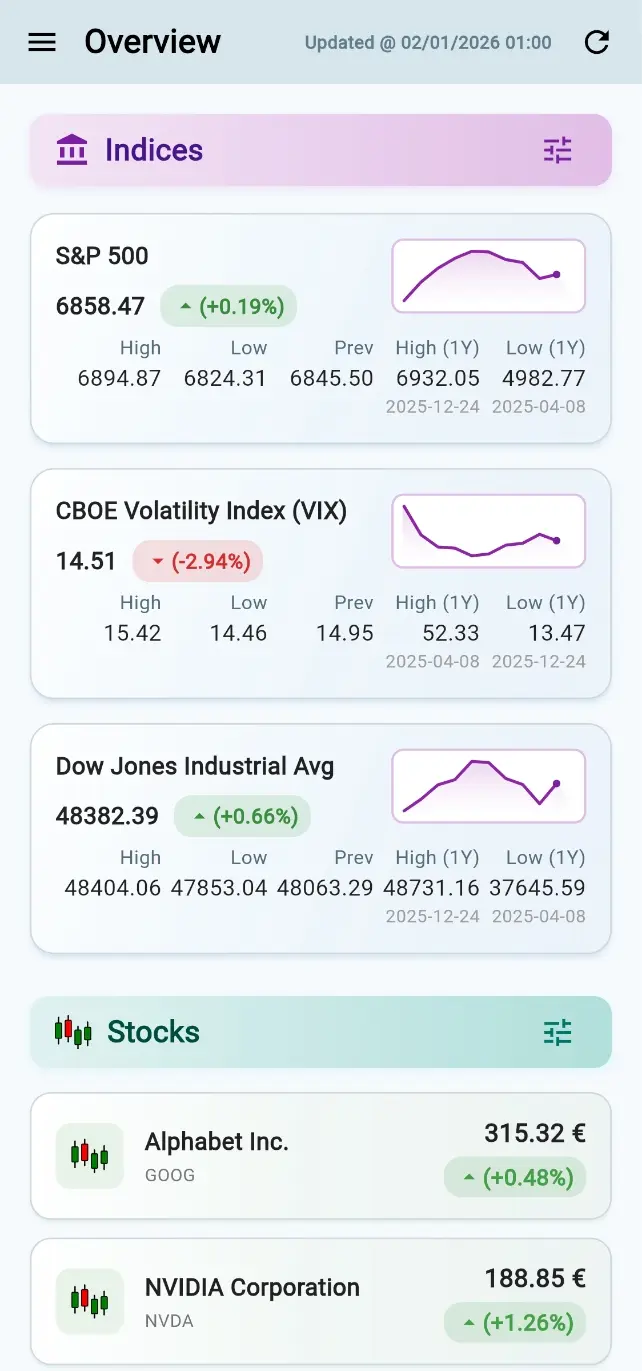
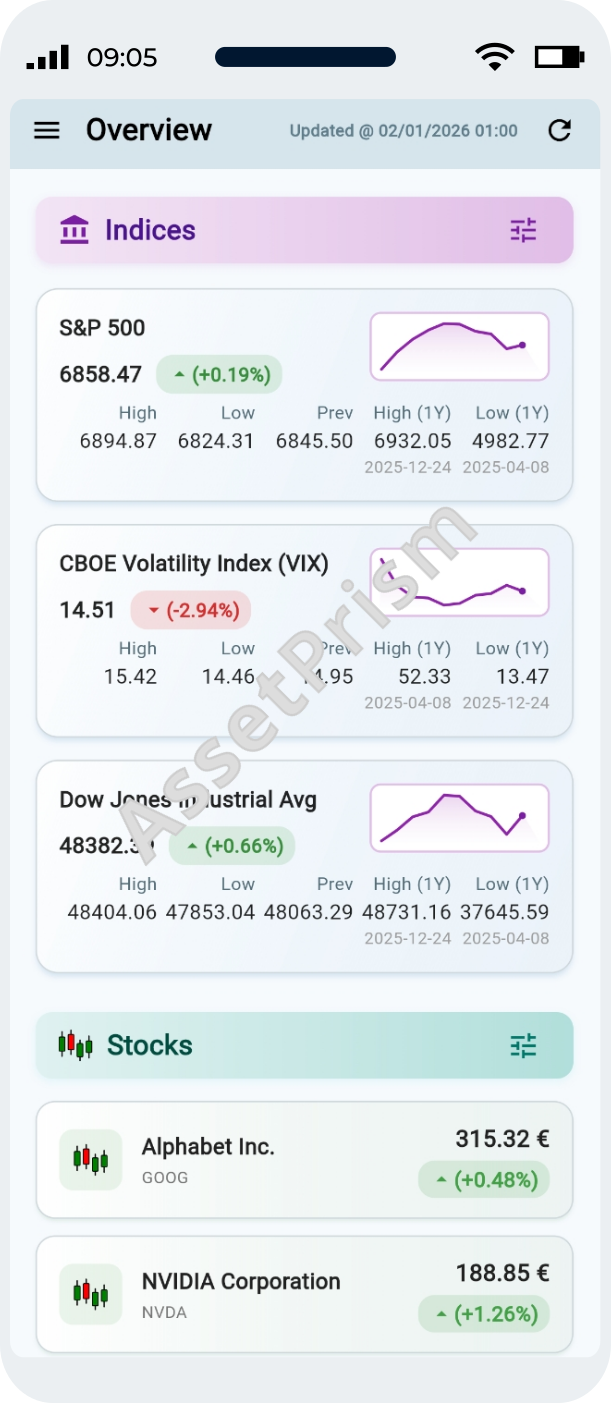
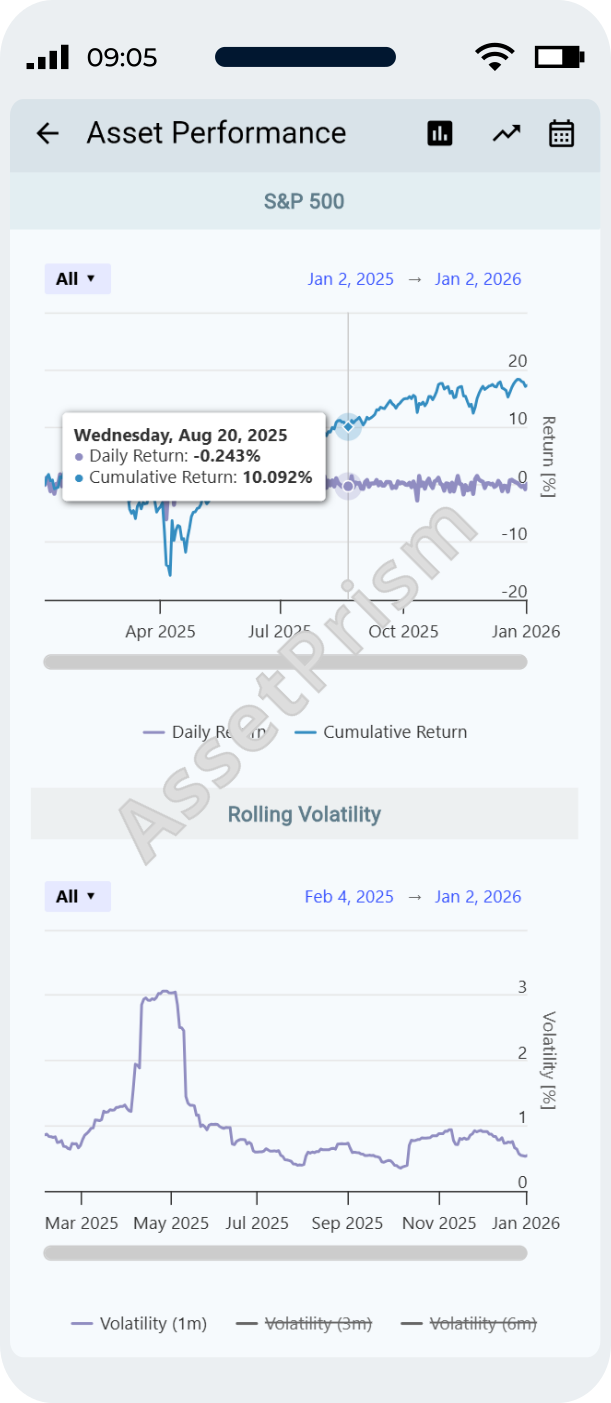
Track Critical Trends
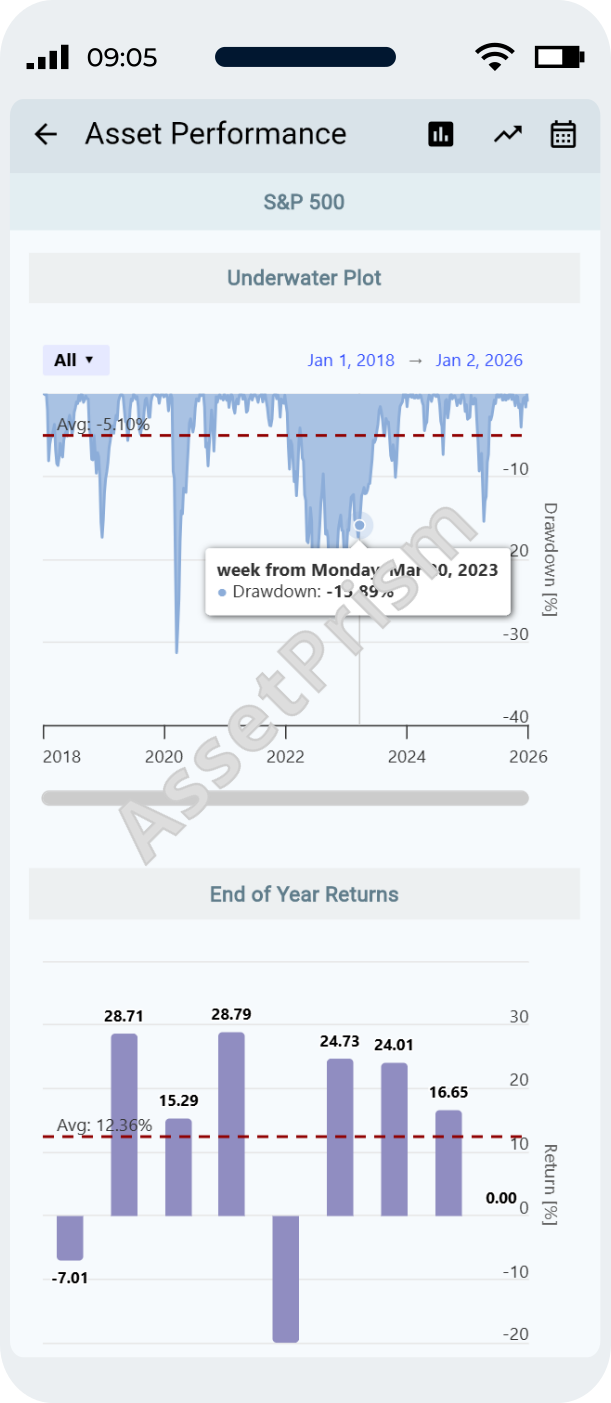
Analyze asset performance with intuitive visualizations, including price plots, returns, volatility, and key metrics like CAGR, Sharpe ratio, and VaR. Access technical indicators like SMA, EMA, and RSI for deeper insights.
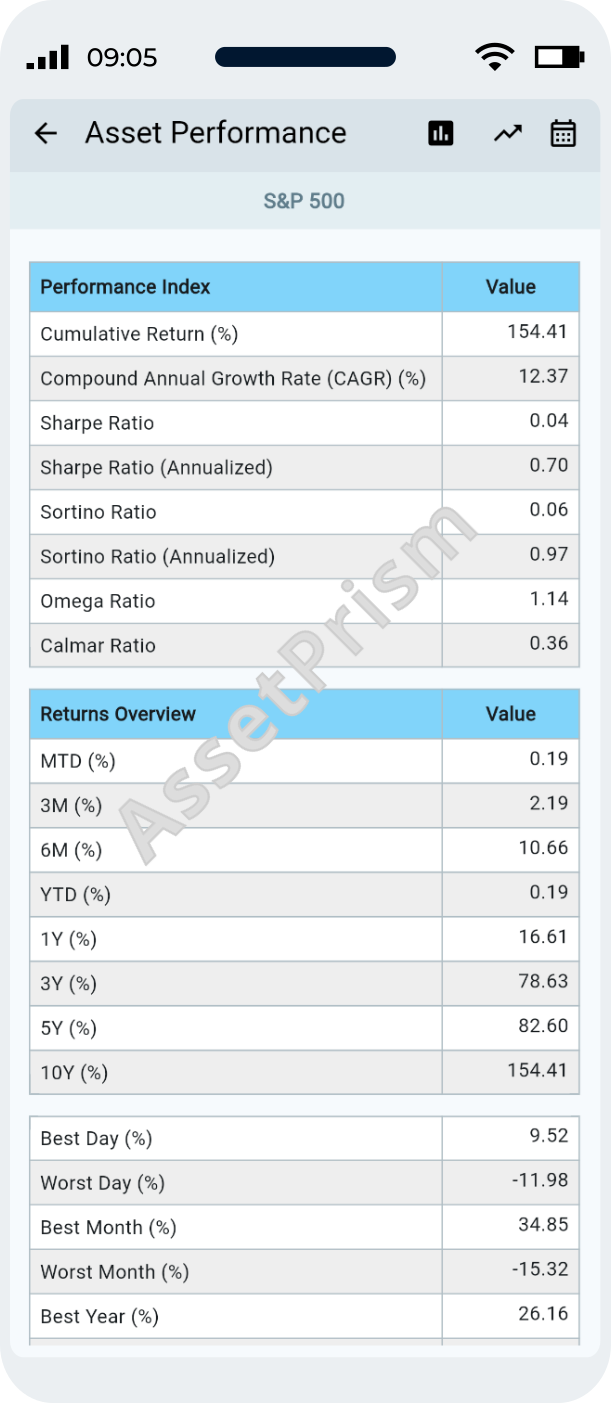
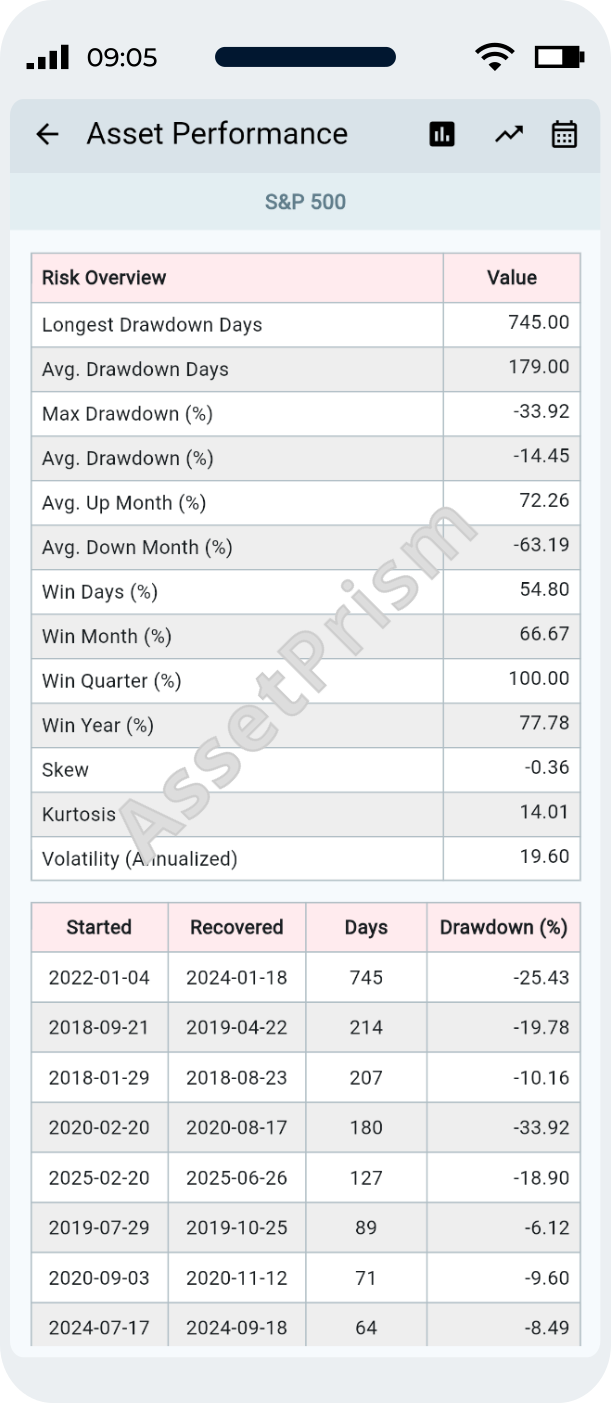
Powerful intuitive visualizations and data analysis tools. Dive deep into an asset's performance with historical price plots, daily and cumulative returns, rolling volatility over custom periods, drawdown history, and end-of-year returns. Comprehensive performance overview with key metrics like compound annual growth rate (CAGR), Sharpe ratio, Sortino ratio, omega ratio, Calmar ratio, and value at risk (VaR), all presented alongside detailed return and risk statistics in an intuitive tabular format. Access to various technical indicators such as simple moving average (SMA), exponential moving average (EMA), Bollinger Bands, relative strength index (RSI), and more.

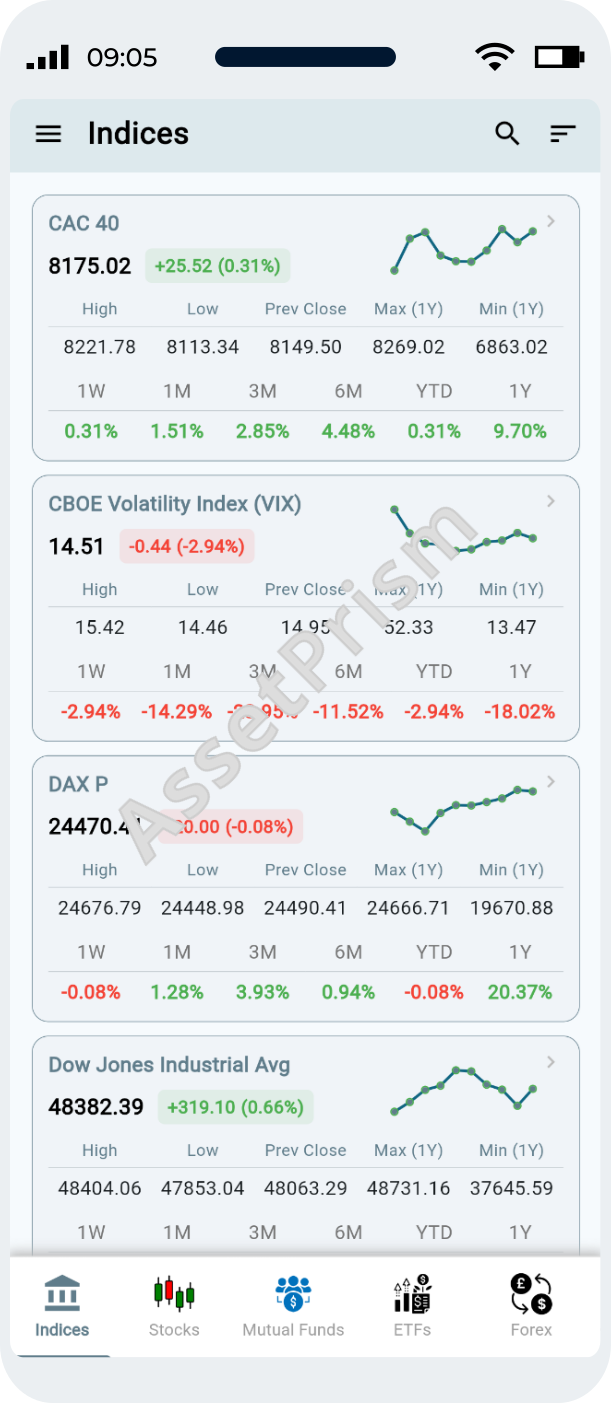
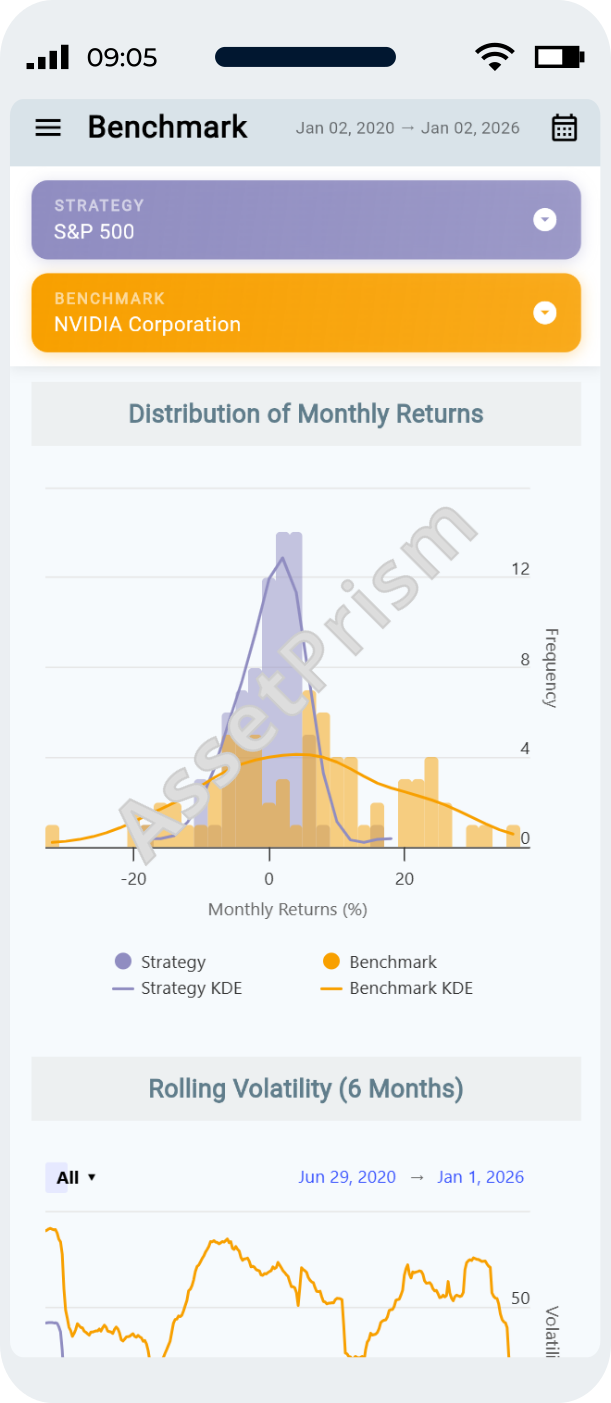
Create Insightful Benchmarks
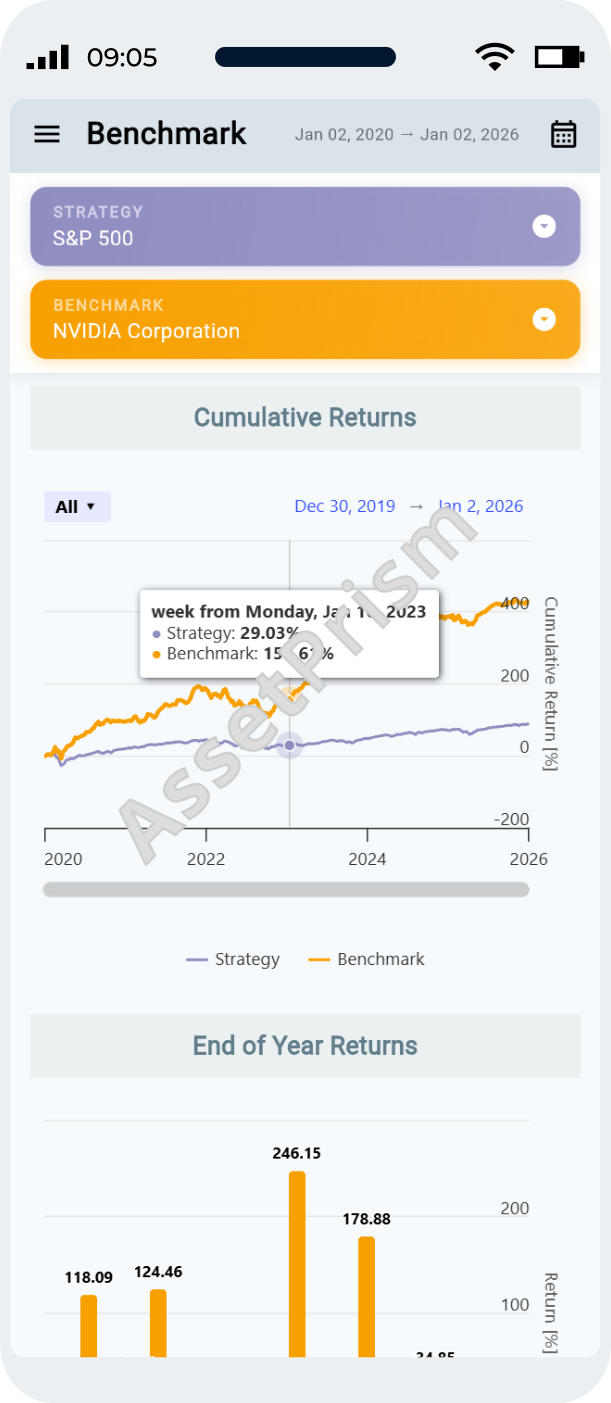
Easily compare asset performance to uncover opportunities for portfolio optimization. Analyze key metrics to make data-driven decisions, enhancing returns while managing risk.
Effortlessly compare the performance of multiple assets to identify potential opportunities for optimizing your investment strategy. By analyzing key performance metrics and trends, you can uncover valuable insights that guide smarter portfolio allocation decisions. This capability enables you to assess the strengths and weaknesses of various assets, helping you make data-driven choices to enhance returns while managing risk. Whether you're diversifying your portfolio or adjusting your allocations, the ability to easily compare asset performance empowers you to optimize your investments effectively.
Additional Features
Analyze portfolios, calculate ROI, and master financial terms with ease
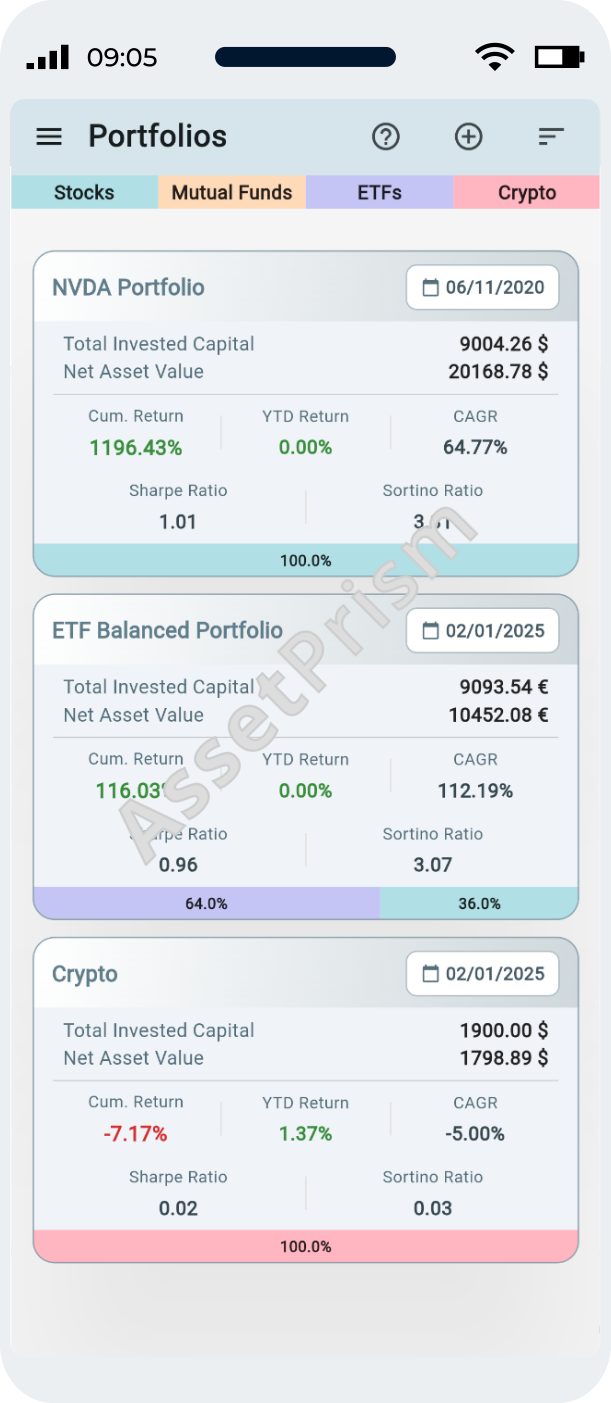
Portfolio Analysis
Effortlessly allocate and analyze your portfolio to maximize returns and minimize risks. Leverage powerful tools to make informed investment decisions and optimize your strategy.
ROI Calculator
Quickly calculate your return on investment (ROI) with an easy-to-use tool that helps you assess asset performance, including time deposits, bonds, mutual funds and stocks. Make informed decisions by evaluating gains or losses across these investment types.

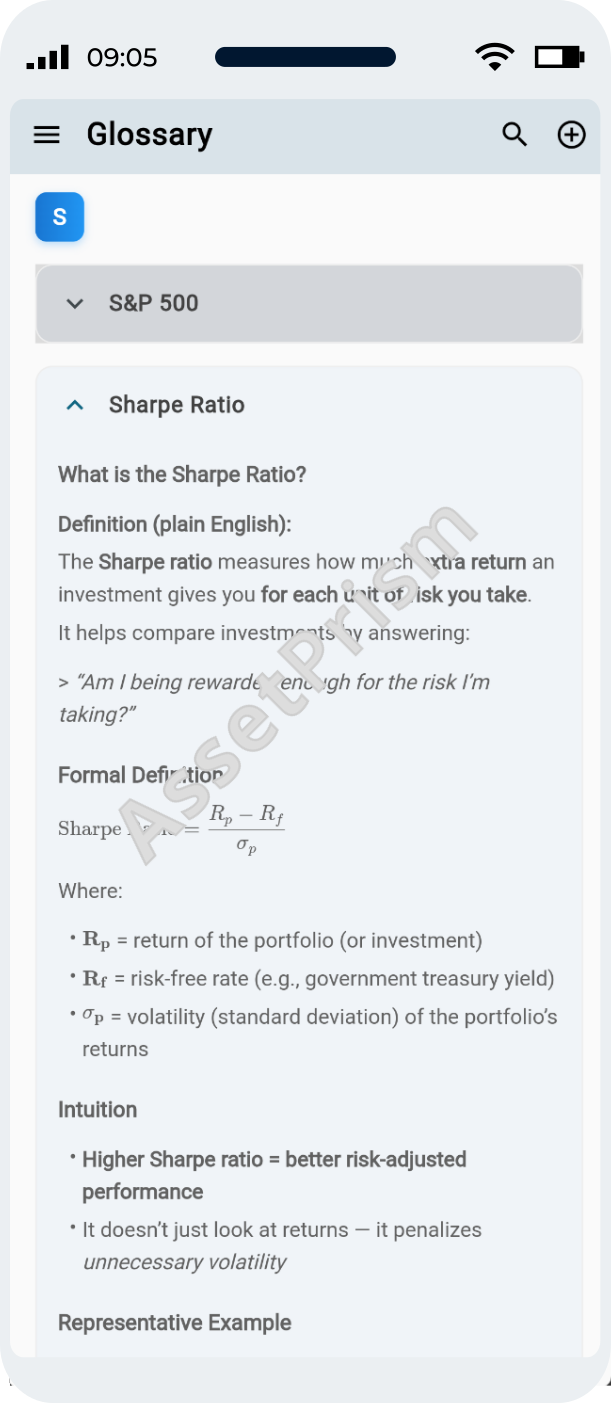
Glossary
Access a comprehensive glossary of financial terms to better understand key concepts and improve your investment knowledge. Easily navigate through definitions to clarify terminology and enhance decision-making.
Gallery
An in-depth look at the key features and functionality of AssetPrism

Frequently Asked Questions
Get answers to your key queries
What asset classes can I track and analyze with this application?
AssetPrism supports an extensive range of asset classes to give you complete portfolio visibility. You can track and analyze stocks from major exchanges worldwide, indexes including S&P 500, NASDAQ, and international benchmarks, exchange-traded funds (ETFs) across multiple sectors and strategies, mutual funds from various providers, commodities, cryptocurrencies and foreign exchange. This comprehensive coverage allows you to build and monitor truly diversified portfolios all within a single unified application, eliminating the need to juggle multiple applications or data sources.
How do I create custom benchmarks for my investments?
Creating custom benchmarks in AssetPrism is intuitive and flexible. Start by navigating to the benchmarks section and selecting the asset classes you want to include—whether that's a combination of stocks, bonds, ETFs, or other securities. Specify your desired allocation percentages for each component to match your investment philosophy. You can create benchmarks that align with conservative, balanced, or aggressive strategies. Once created, AssetPrism automatically tracks your portfolio's performance against these custom benchmarks in real-time with detailed comparison charts and metrics. You can create multiple benchmarks to compare different allocation strategies, analyze what-if scenarios, and understand how alternative portfolio structures would have performed historically. The application provides visual comparisons showing outperformance or underperformance, helping you identify whether your portfolio is meeting your strategic objectives. This dynamic benchmarking capability is essential for portfolio review, performance attribution analysis, and strategic rebalancing decisions.
How does the ROI Calculator work?
The ROI Calculator is a versatile tool for evaluating investment performance across all asset types. Simply enter your initial investment amount, the final value of your position, the date range, and any fees or costs incurred during the holding period. The calculator instantly computes your return on investment as both a percentage and absolute profit amount. It supports comprehensive scenarios including time deposits, bonds, mutual funds, and stocks. Advanced features include automatic annualized return calculation for easy performance comparison, internal rate of return (IRR) computation for complex cash flows, and holding period adjustment for meaningful comparisons across different investment durations.
What technical indicators are available for analysis?
You can access a wide range of technical indicators, such as the Simple Moving Average (SMA), Exponential Moving Average (EMA), Bollinger Bands, and Relative Strength Index (RSI), to deepen your market insights.
What key metrics are available for analyzing asset performance?
The application offers a variety of key metrics including Compound Annual Growth Rate (CAGR), Sharpe Ratio, Sortino Ratio, Calmar Ratio, Omega Ratio, and Value at Risk (VaR), to help you evaluate performance and risk.
Can I compare the performance of multiple assets?
Absolutely! Advanced asset comparison is a cornerstone feature of AssetPrism. Select any combination of assets i.e. stocks, ETFs, mutual funds, cryptocurrencies, commodities, or indices and view comprehensive side-by-side comparisons. Analyze price performance over custom time periods, compare cumulative returns from any starting date, examine how assets behaved during different market cycles, and evaluate volatility and drawdown characteristics. The application generates professional comparison charts showing relative performance trends and overlapping price movements. Calculate correlation matrices to understand diversification benefits and identify which assets move together during market stress. Compare risk-adjusted return metrics across multiple assets to identify true outperformers beyond raw return numbers. Segment-specific analysis breaks down performance by market sector, geographic region, or asset type. Backtesting capabilities let you simulate different portfolio combinations and see how they would have performed historically. Export detailed comparison reports for presentations or archiving. These powerful tools make it easy to identify your best and worst performers, spot sector trends, detect correlation breakdowns, and make data-driven allocation adjustments to optimize portfolio efficiency and maximize risk-adjusted returns.